Introduction
Following on from using a Raspberry Pi to capture the electricity consumption of my home, I have over the last 2 years installed Solar Thermal Hot Water panels and very recently Solar PV. This meant that I had an opportunity to create something I had been looking to do for a while – an in house portable “Home Energy Centre”. This post documents the thought process behind what I did, the choices I made and also the problems and hurdles I had to overcome to get it all up and running. First let’s talk about the Home Energy Centre.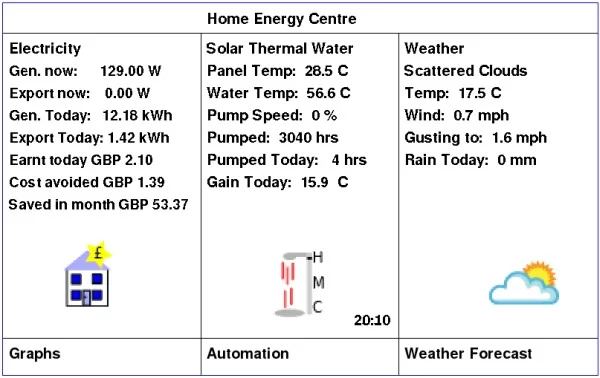
Hec-display in kitchen
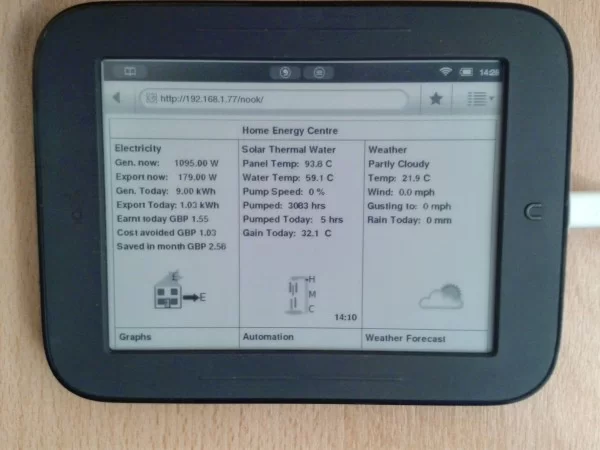
This is built on a “Nook Simple Touch”, which I bought about a year ago during National Book Week for only £21!
Why did I choose this device? Several reasons really,
- it was cheap!
- It has built in Wi-Fi
- It is easily hackable (with Nook Manager)
- the battery life is good (about 1 week with wireless running all the time and the display refreshing)
- it has a touch screen
- it is small and can easily be mounted (either in a frame or on a fridge using magnetic adhesive tape)
- I can always re-use it as an e-book reader!
The “Home Energy Centre” (HEC) runs in the browser of the Nook. Because it runs in a browser it can also be displayed on any device with a browser, for example PC, Laptop, Mobile Phone.
The screen is split into 3 main sections.
The left hand section displays information on how the Solar PV panels are performing; telling me what Electricity is being generated now, if any is being exported, along with the totals for the day so far. This updates automatically reasonably frequently.
The middle column displays information on how the Solar Thermal Panels are performing, these provide hot water. So the display shows me, the current temperature of the panels, the current temperature of the water in the hot water tank; along with, the speed of the pump as a percentage and the number of hours the pump has run in total. The lower section tells you for how many hours the pump has run so far today, and importantly what the temperature gain in the Hot Water has been so far this day.
The right hand column displays the current weather for where I live.
Along the bottom are 3 “buttons”, for now only the left hand button works and this takes me to the graphs of electricity consumption. This information all in one place and readily visible has help us decide when to use electrical appliances in the house and when to or not heat the hot water using the central heating (Gas based) system we have in the house.
High Level Architecture
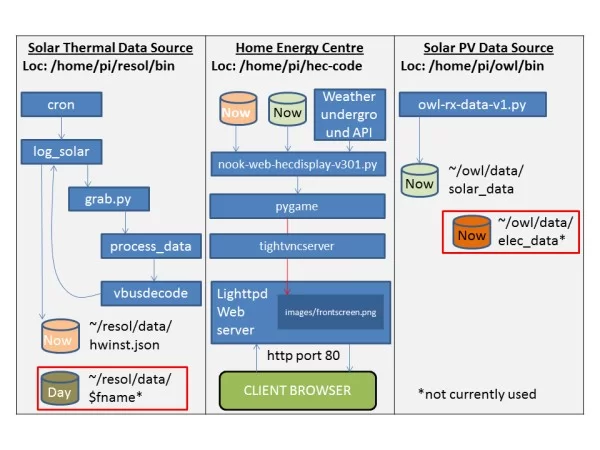
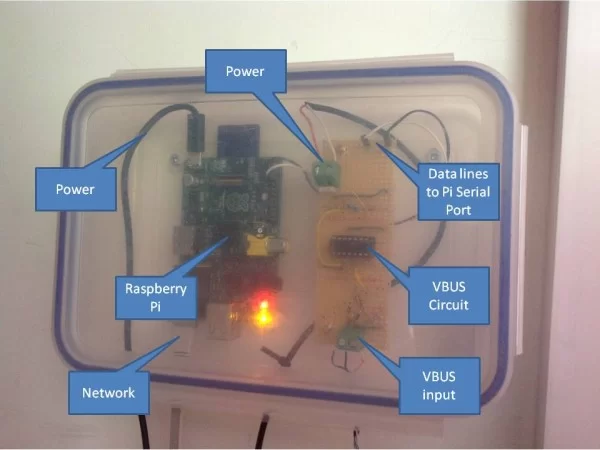
The Raspberry Pi performs all of these functions:
- Receives Solar Thermal output from the Resol pump controller via its VBUS data bus and the electronic circuit, into the tty0 serial port.
- Decodes the data calculates values and files it ready for processing
- Receives over the local network, via multicast, Solar and Electricity xml packets from the Owl Intuition Solar PV monitoring and files it ready for processing
- Runs the program to draw the Home Energy Display (python/pygame) as a picture, this program also fetches the latest weather information from Weather Underground via the internet.
- Runs tightvncserver (required by pygame)
- Runs lighttpd server to serve the image map / web page that is displayed on the Nook, or any web browser/mobile phone.
Solar Thermal Real Time Data Solution
Getting meaningful data from the Solar Thermal panels was definitely a challenge. I didn’t want to spend over £100 on a special LAN adapter they sell. My system has a Resol© BS/4 pump controller which has a VBUS© data bus output. The signal this bus produces is similar to RS485 in that it is a dual polarity signal, but not exactly the same. I designed the following circuit to process the signal and turn it into 9600 baud 0V, 3.3V serial data suitable for interfacing to a Raspberry Pi.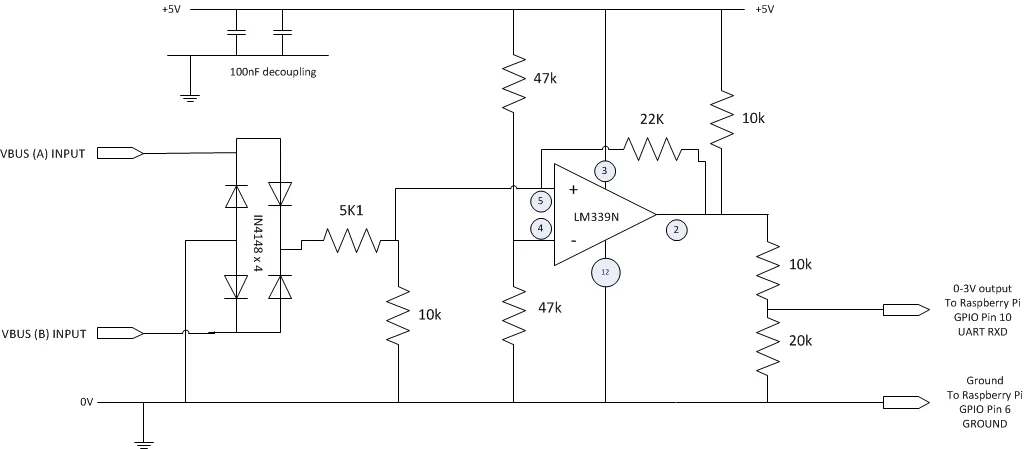
Please note this circuit is not electrically isolated from the VBUS controller, which does switch a relay for the pump which runs from mains electricity. If an electrical fault occurs in the VBUS controller it could fry the circuit or the Raspberry PI. In a revised version I would incorporate an opto-isolator. The circuit is also designed only to receive data and not transmit it. If you want to use this circuit with a device that withstands 0,5V serial data, e.g. an Arduino©, then just remove the two resisters that form the voltage divider at the output. Remember to stop the Pi from starting the default tty0 terminal on the serial port. Now that we have some nice clean serial data coming into the Pi, we need to process it. The Resol protocol is quite unique in that it swaps MSB and LSB’s around so that only the starting byte of a sequence of data has its MSB set, &AA signifies the start of a sequence of data. Fortunately for me, someone far cleverer than me has written a C program to do this called “vbusdecode”. The next problem I had was that you need to know the XML format of the data for the controller you have in order to tell vbusdecode what to do. This information is not supplied in the documentation from Resol. After a lot of research and hunting and many false trails, I found an XML specification file in the installation files for some free software until recently given away buy Resol. This means that finally we can decode the data coming via the VBUS. I discovered that the BS/4 sends out three different types of data, I am only interested in one type and I want the data in CSV format, so I modified the source code for “vbusdecode” to do this. So every day a new file is created to store the Solar Thermal Data and every few minutes a new line of data is added. This file is used by the HEC display program as the source of its Solar Thermal data.
Solar PV Solution
This solution was far simpler and one I got working in two evenings. The OWL© PV Intuition product comes with a device that spits out data in a multicast group on the local network. It also has a published API and can also be configured to push data to a certain IP address and port. I took the simple route and just used the multicast data. I have adapted an already created Python library/set of classes for receiving multicast data. Two types of XML datagrams are received approximately every 30 seconds, one for Electricity consumption and one for PV generation and Export. This program receives the XML data, decodes it and stores them in two files on the Raspberry Pi to process. The code is here.
HEC Display Program
This is main program that pulls all of the data sources together and creates the Home Energy Centre display. It is written in Python and Pygame. My original idea was to serve the display in an X-window using tightvncserver on the Raspberry Pi, and view it using the VNC client for Android. This proved problematic on the Nook, as in order to get the VNC client on the Nook I needed to install all of the google apps and the google play store app. This made the nook unstable. So I reverted to a different plan: just use the web browser on the nook, and change the main program to paint (save) a picture of the screen to an image file – which is web served to the browser. This works well in pygame and is easy to code. I have subsequently removed the majority of the Google apps from the Nook and it is much more responsive and stable.
Lighttpd Configuration and Webpage.
The Pi is running a standard install of lighttpd. It serves a very basic index.html web page like so:
This serves the “picture” of the HEC display as an image map, allowing mouse clicks or touch screen (on the nook) presses to be detected and appropriate actions taken. The page auto refreshes. There is another version of the page in a sub directory called nook, which is the same apart from having a slower refresh rate. This helps conserve the battery life of the nook.
Physical Installation
Everything is installed in a cupboard near to the pump controller for the Solar Hot water in a £ 3 Sandwich box!
Nook Modifications
The Nook has been rooted with NookManager. There are plenty of articles on how to do this. For example:
http://www.babblingengineer.com/how-to/how-i-turned-my-nook-into-an-e-reader-monster/
For information on installing NGAppsAttack look here.
I have also made the following modifications to remove the screen saver/timeout and slow down the screen refresh method to conserve battery life. Instructions for this can be found in this thread: http://forum.xda-developers.com/showthread.php?p=29113425
Known Problems/Irritations
The Pi sometimes locks up and is not reachable across the network. This was cured by removing the lid of the sandwich box!
Tightvncserver sometimes locks up.
Things to improve, things to do.
Start logging the Solar Thermal Data and the Solar PV data in RRD so daily graphs can be produced
Tidy up the code for the Solar Thermal side.
Implement a 5 day weather forecast using the UK Met office’s data point service and implement the Forecast Button
Implement the Automation button (that is a topic for another time!)
Thanks for Reading!
I hope you have found this interesting and it inspires you to do something with a Raspberry Pi. Also thanks to the world wide web, all of the credits listed above and Simon, Stuart, Ashleigh and Mark for putting up with me and giving me encouragement on this project!
Source: Home Energy Centre using Raspberry Pi and Nook Simple Touch
About The Author
Hassan Zaka
I am an expert in accounting and possess diverse experience in technical writing. I have written for various industries on topics such as finance, business, and technology. My writing style is clear and simple, and I utilize infographics and diagrams to make my writing more engaging. I can be a valuable asset to any organization in need of technical writing services.
Follow Us:LinkedinTwitter